 There are currently eight teams playing the IPL with Chennai Super Kings and Rajasthan Royals suspended for two years. A team can acquire players in five ways: the annual auction, signing domestic players, signing uncapped players, trading players, and signing replacements. The teams can retain a maximum of five players and remaining players have to be auctioned.
The aim of this piece is to quantify the returns that the teams have got on their investments for players bought in the auction. This is done using the IPL’s own MVP (most valuable player) points as the performance criteria of a player. The teams’ bidding efficiency is judged by how much money they have spent per MVP point across all auctions. The players with the lowest cost per MVP point (taking a minimum of 100 points) have been the best value for money purchases.
The analysis is done only for the year the player has been bought and doesn’t include subsequent years’ performance of the player if retained by the team. The time period for this analysis is 2013-2016.
MVP Points Calculation
• 2.5 points for each four
• 3.5 points for each six
• 3.5 points for each wicket taken
• 1 point for each dot ball bowled
• 2.5 points for each catch or stumping taken
Best Performers
A look at the top performers reveals that spinners have provided the most value. Yuzvendra Chahal, Amit Mishra & Pravin Tambe have been the standouts. 8 of the top 15 players are bowlers, likely due to the weightage given to dot balls. Chahal has been quite a find for Royal Challengers Bangalore (RCB), as his performance has only improved in subsequent years.
Best Performing Players (more than 100 Points)
|
Player
|
Team
|
Year
|
Four
|
Sixes
|
Wickets
|
MVP Points
|
Rs. Spent Per MVP Point
|
|
Yuzvendra Singh Chahal
|
Royal Challengers Bangalore
|
2014
|
0
|
0
|
12
|
164.5
|
6K
|
|
Amit Mishra
|
Gujarat Lions
|
2016
|
0
|
0
|
13
|
143.5
|
7K
|
|
Pravin Tambe
|
Rajasthan Royals
|
2014
|
0
|
0
|
15
|
141.5
|
7K
|
|
Hardik Pandya
|
Mumbai Indians
|
2015
|
11
|
8
|
1
|
105.0
|
10K
|
|
Mitchell McClenaghan
|
Mumbai Indians
|
2015
|
0
|
2
|
18
|
198.0
|
15K
|
|
Akshar Rajesh Patel
|
Kings XI Punjab
|
2014
|
6
|
1
|
17
|
252.5
|
30K
|
|
Ashok Dinda
|
Rising Pune Supergiants
|
2016
|
0
|
0
|
11
|
122.5
|
41K
|
|
Naman Ojha
|
Sunrisers Hyderabad
|
2014
|
14
|
17
|
0
|
112.0
|
45K
|
|
Marcus Stoinis
|
Kings XI Punjab
|
2016
|
13
|
4
|
8
|
113.5
|
48K
|
|
Sandeep Sharma
|
Kings XI Punjab
|
2014
|
0
|
0
|
18
|
174.5
|
49K
|
|
Karun Nair
|
Rajasthan Royals
|
2014
|
38
|
9
|
0
|
136.5
|
55K
|
|
Aaron Finch
|
Gujarat Lions
|
2016
|
45
|
11
|
0
|
158.5
|
63K
|
|
Thisara Perera
|
Rising Pune Supergiants
|
2016
|
7
|
11
|
9
|
156.0
|
64K
|
|
Mustafizur Rahman
|
Sunrisers Hyderabad
|
2016
|
0
|
0
|
17
|
201.5
|
69K
|
|
Christopher Morris
|
Rajasthan Royals
|
2015
|
3
|
5
|
13
|
191.0
|
73K
|
Highest Bids
Yuvraj Singh features in 3 of the top 10 bids at the auctions, as he was the most paid cricketer in IPL for 2014 & 2015. Delhi Daredevils (DD) and RCB are among the big spenders as they hope to get the best players for their team. This makes sense as DD have struggled to make players perform, and usually don’t retain big players as their big bets haven’t paid off yet.
|
Player
|
Team
|
Year
|
Bid Amount(in crores of Rs.)
|
MVP Points
|
Rs. Spent Per MVP Point
|
|
Yuvraj Singh
|
Delhi Daredevils
|
2015
|
16.0
|
112.0
|
1429K
|
|
Yuvraj Singh
|
Royal Challengers Bangalore
|
2014
|
14.0
|
211.0
|
664K
|
|
Dinesh Karthik
|
Delhi Daredevils
|
2014
|
12.5
|
131.0
|
954K
|
|
Dinesh Karthik
|
Royal Challengers Bangalore
|
2015
|
10.5
|
96.5
|
1088K
|
|
Shane Watson
|
Royal Challengers Bangalore
|
2016
|
9.5
|
283.0
|
336K
|
|
Kevin Pietersen
|
Delhi Daredevils
|
2014
|
9.0
|
114.5
|
786K
|
|
Pawan Negi
|
Delhi Daredevils
|
2016
|
8.5
|
35.0
|
2429K
|
|
Angelo Mathews
|
Delhi Daredevils
|
2015
|
7.5
|
149.0
|
503K
|
|
Christopher Morris
|
Delhi Daredevils
|
2016
|
7.0
|
247.0
|
283K
|
|
Yuvraj Singh
|
Sunrisers Hyderabad
|
2016
|
7.0
|
110.0
|
636K
|
IPL Teams’ Price Paid vs MVP score
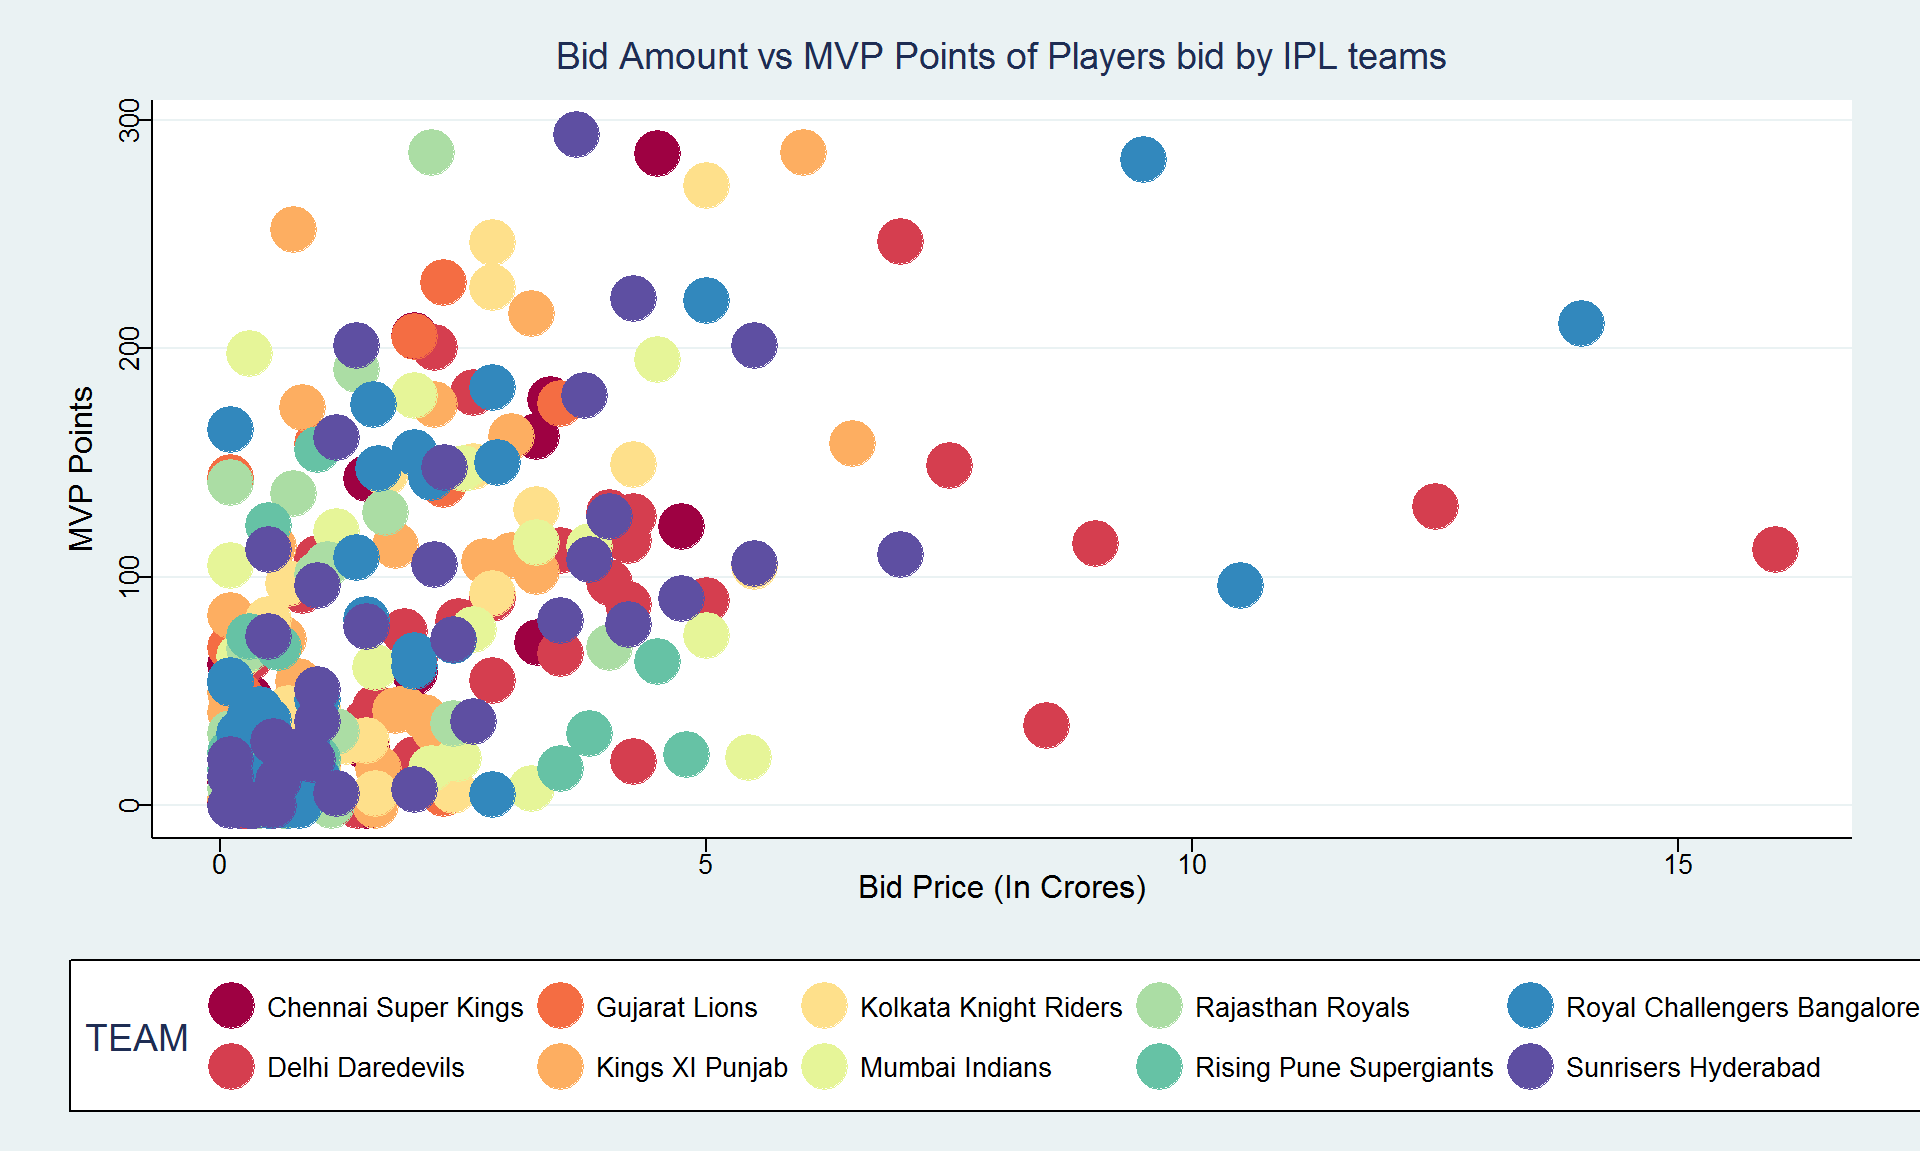
The graph shows that DD and RCB occupy the high bid range, further illustrating that DD haven’t got great results with their high bids.
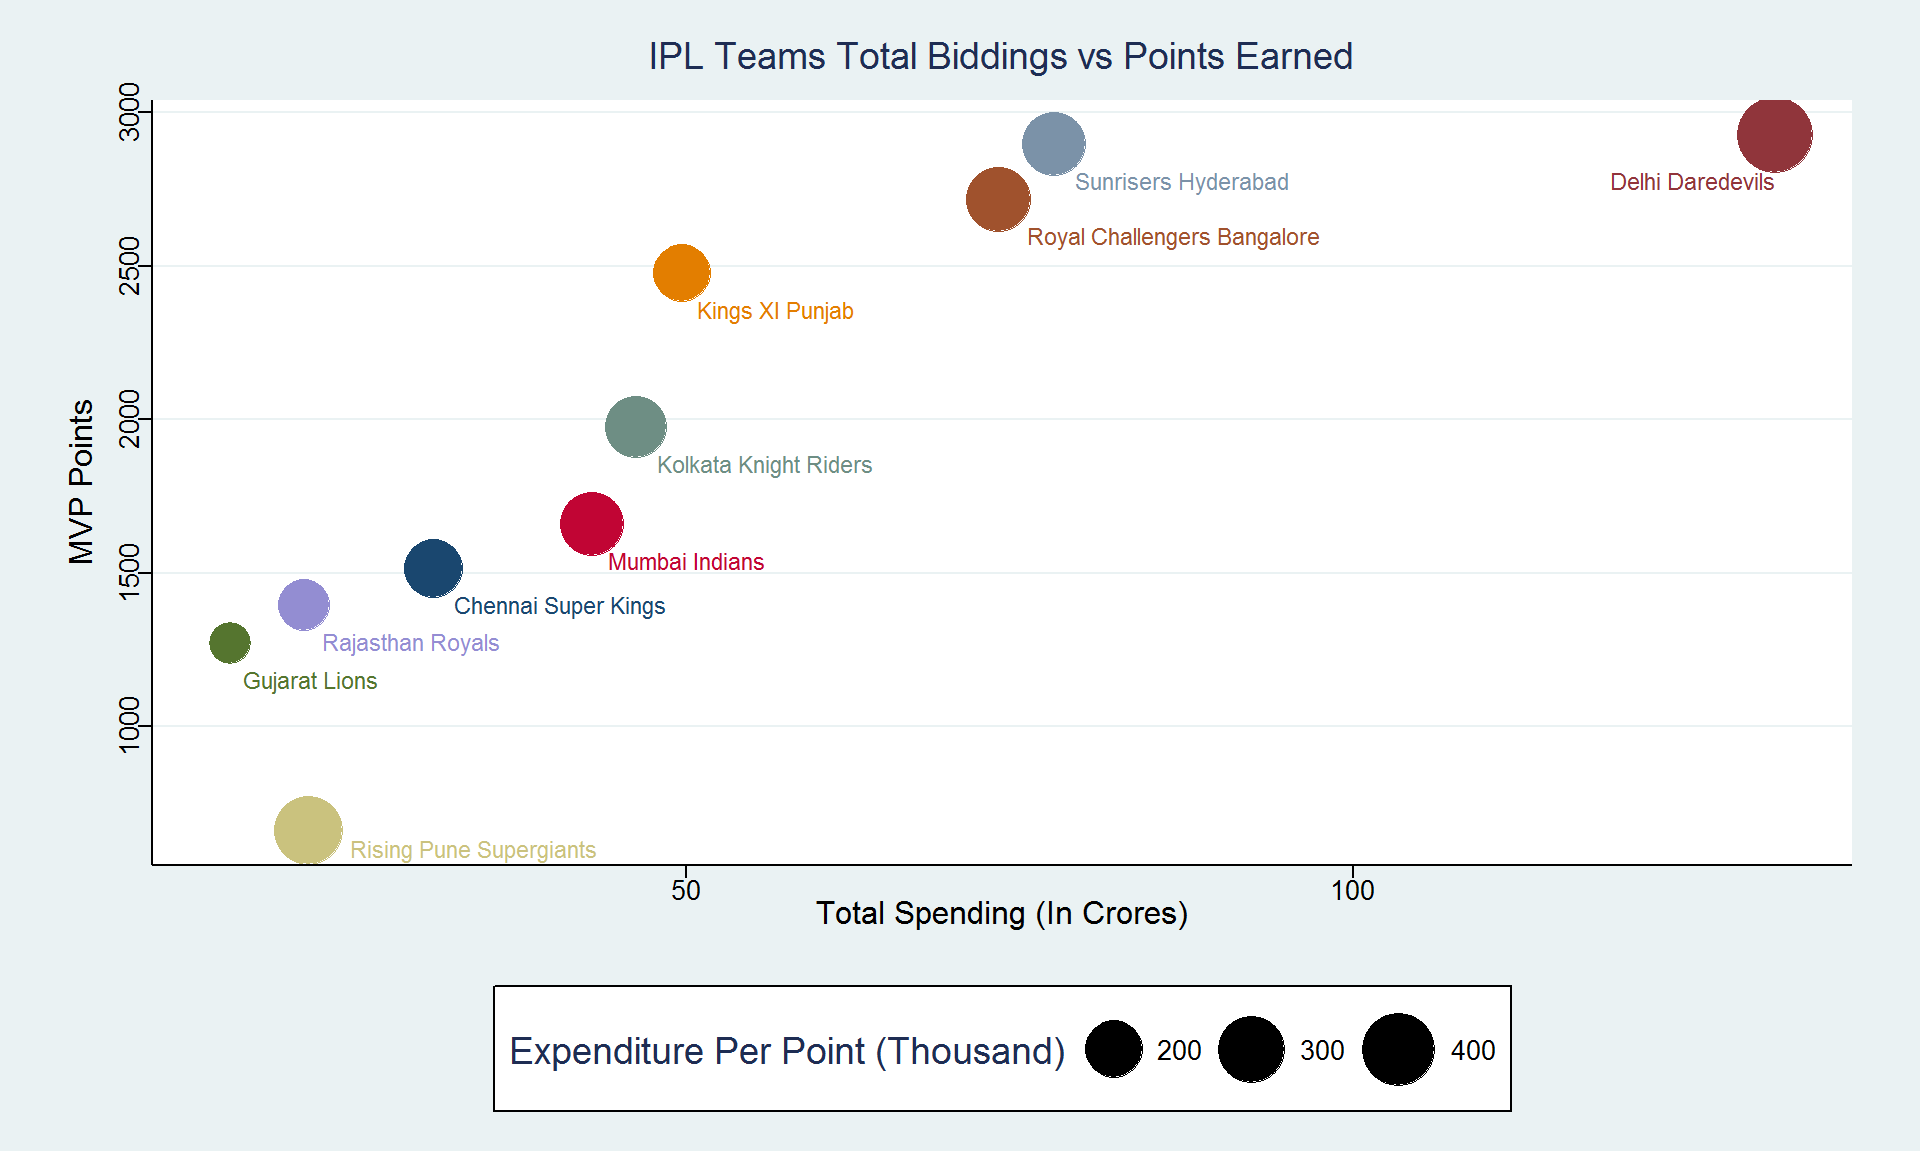
A look at teams getting the most out of their auction bids reveals that new entrants Gujarat Lions (GL) have had great returns from their bid players; the other new team, Rising Pune Supergiants (RPS), have had a forgettable first season. Rajasthan Royals (RR) have proved that you don’t need to spend a lot on players and have made some very smart bids and have got great returns. Unsurprisingly, DD have got the least returns as their big bets have failed to give results.
|
Team
|
Total Bid Value (Crores of Rs.)
|
Total MVP Points
|
Amount Spent Per Point
|
|
Gujarat Lions
|
15.8
|
1271.5
|
125K
|
|
Rajasthan Royals
|
21.4
|
1395.0
|
154K
|
|
Kings XI Punjab
|
49.7
|
2475.5
|
201K
|
|
Chennai Super Kings
|
31.1
|
1515.0
|
205K
|
|
Kolkata Knight Riders
|
46.3
|
1976.0
|
234K
|
|
Mumbai Indians
|
43.0
|
1659.0
|
259K
|
|
Sunrisers Hyderabad
|
77.6
|
2897.0
|
268K
|
|
Royal Challengers Bangalore
|
73.4
|
2716.5
|
270K
|
|
Rising Pune Supergiants
|
21.7
|
663.0
|
327K
|
|
Delhi Daredevils
|
131.6
|
2925.0
|
450K
|
Stats by: Mudassir Khan
Fast. Lite. Innovative. Shareable. Download our HW Cricket app!